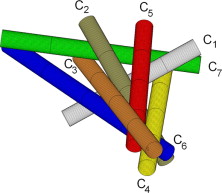
Here's a Sage / Python program which creates a 3D plot of the second solution from the paper by Bozóki, Lee, and Rónyai. The plot is interactive (using three.js), so you can pan, zoom, and rotate the camera, using the mouse, or on a touch screen. This makes it easier to verify that the cylinders are actually mutually touching.
""" Seven mutually touching (infinite) cylinders
From https://www.sciencedirect.com/science/article/pii/S0925772114000819
"""

data = [
[
 2.075088491891,
-2.036516392124,
-0.030209763440,
 0.599691085438,
],[
-2.688893665930,
 4.070505903499,
 0.184499043058,
 0.426965115851,
],[
-4.033142850644,
-2.655943449984,
 0.251380280590,
 0.516678258430,
],[
 6.311134419772,
-5.229892181735,
-0.474742889365,
 1.230302197822,
],[
 3.914613907006,
-7.881492743224,
 1.698198197367,
-1.164062857743,
]]

ps = [[0,0,-1], [0,0,1]]
ps += [row[:2] + [0] for row in data]

ws = [[1,0,0], [0,1,0]]
ws += [row[2:] + [1 - sum(row[2:])] for row in data]

colors = ["white", "grey", "brown",
 "yellow", "red", "blue", "green"]

s0, s1 = -15, 35
def cyl(p, w, color):
    p0 = [u + s0*v for u, v in zip(p, w)]
    p1 = [u + s1*v for u, v in zip(p, w)]
    return line3d([p0, p1], radius=1, color=color)

show(sum(cyl(p, w, c) for p, w, c in zip(ps, ws, colors)), frame=False)
Here's a live version of the script, running on the SageMathCell server.
You can adjust the end points of the cylinders by changing the values of the s0 and s1 parameters.
I've made a minor improvement to the script. It now normalises the lengths of the w vectors to 1, so all the cylinders have the same length. Please see the script link for details.

